


 By
- Aaliya Yousaf.
 Blog
A deep-dive guide for managers, team leads, and executives who want real visibility into team productivity, project health, workload distribution, and business outcomes using Asana.
Most managers have a gut feeling about how their team is performing. But gut feelings don't scale — and they rarely provide the evidence executives, stakeholders, or board members need to make informed decisions.
Real performance management requires data. The challenge is that many teams are overwhelmed with work but lack visibility into what's actually happening. Deadlines slip, workloads become unbalanced, projects stall, and bottlenecks remain hidden until they become major problems.
This is exactly where Asana Reports & Analytics becomes invaluable. When configured properly, Asana transforms from a simple task management platform into a comprehensive performance intelligence system that helps leaders understand team output, capacity, project health, sprint velocity, and goal achievement.
In this guide, we'll show you exactly how to use Asana reporting tools to measure team performance, identify issues before they become critical, and make smarter management decisions backed by data.
Before diving into performance metrics, it's important to understand the reporting tools available inside Asana.
| Feature | Purpose | Available On |
|---|---|---|
| Reporting Dashboards | Custom charts and performance visualizations | Premium, Business, Enterprise |
| Workload View | Capacity Planning and workload balancing | Business, Enterprise |
| Portfolio Reporting | Track multiple projects simultaneously | Business, Enterprise |
| Goals (OKRs) | Track strategic objectives and outcomes | Business, Enterprise |
| Universal Reporting | Cross-project reporting and advanced filtering | Premium+ |
| Asana Intelligence | AI-powered insights and risk detection | Business, Enterprise |
| Timeline View | Roadmapping and dependency tracking | Premium+ |
| Task Completion Metrics | Track completion percentages | All Plans |
| Burnup & Burndown Charts | Agile sprint reporting | Business, Enterprise |
Not every metric deserves your attention. These five KPIs provide the clearest picture of how your team is actually performing.
Task Completion Rate measures how many assigned tasks are completed within a given time period.
This metric shows how consistently your team completes work before deadlines.
High-performing teams maintain balanced workloads. Overloaded team members burn out faster and miss deadlines more frequently.
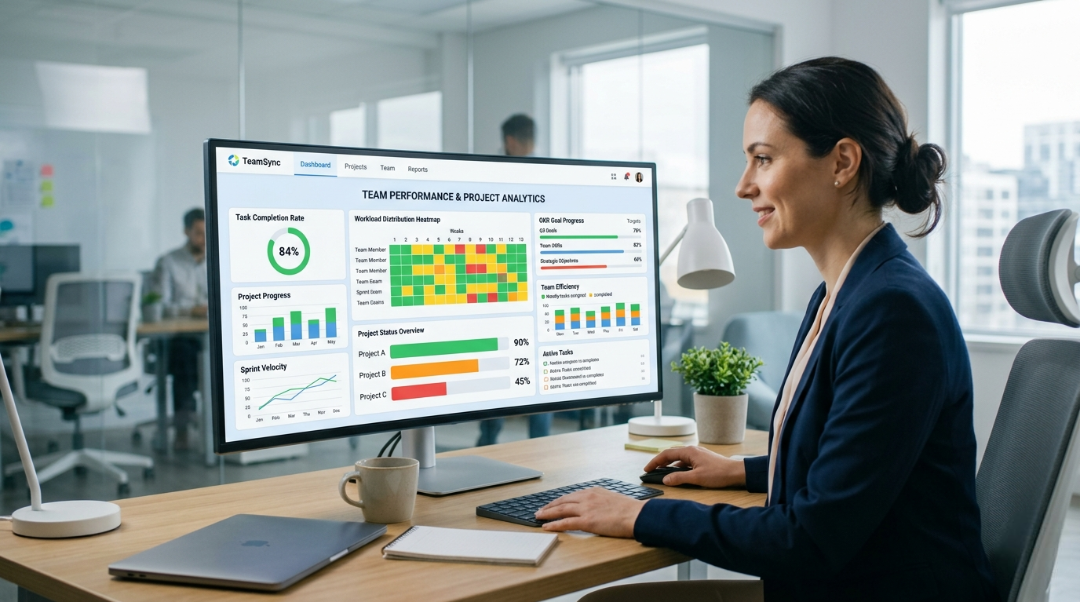
Workload View provides a visual heat map where overloaded employees appear in red while balanced workloads appear in green.
Managers need visibility into project status, milestone completion, and potential risks.
Portfolio View provides a high-level summary of every active project and highlights projects that may require intervention.
| Status | Meaning | Recommended Action |
|---|---|---|
| On Track | Progressing as planned | Monitor weekly |
| At Risk | Delays or dependency issues | Review with team lead |
| Off Track | Major delays or missed milestones | Escalate immediately |
| ⏸ On Hold | Project intentionally paused | Set resume timeline |
Completing tasks means very little if those tasks don't contribute to company goals.
Asana Goals enables organizations to connect daily execution with quarterly and annual objectives.
Dashboards provide leadership teams with a single source of truth.
Go to Reporting → New Dashboard and create a dashboard named something like:
Team Performance Dashboard – Q3 2026
| # | Chart Name | Metric | Chart Type |
|---|---|---|---|
| 1 | Task Completion Rate | Completed tasks by assignee | Bar Chart |
| 2 | Overdue Tasks | Past due tasks by assignee | Bar Chart |
| 3 | Workload Distribution | Open tasks per person | Bar Chart |
| 4 | Project Health | Portfolio status overview | Donut Chart |
| 5 | Created vs Completed | Task flow over time | Line Chart |
| 6 | Upcoming Deadlines | Tasks due within 7 days | Table View |
Filter reports by department, team, project, sprint, or date range to keep dashboards relevant.
Use Asana's sharing options to provide view-only access to executives, HR, department heads, or board members.
| Role | Key Metrics | Feature | Review Frequency |
|---|---|---|---|
| Team Lead | Completion rate, blockers, overdue tasks | Dashboards, Workload | Weekly |
| Project Manager | Milestones, project health, velocity | Portfolio, Timeline | Weekly |
| Engineering Manager | Sprint metrics, cycle time | Sprints, Burndown | Per Sprint |
| HR / People Ops | Capacity & burnout risk | Workload View | Bi-weekly |
| Executives | OKRs, strategic progress | Goals & Portfolio Reporting | Monthly |
Without due dates, performance reports cannot accurately measure on-time completion.
Teams must update statuses, blockers, and progress information regularly to maintain accurate reporting.
Completion rates alone don't reveal burnout risk. Always evaluate workload balance alongside productivity metrics.
Strategic Objectives should be directly connected to operational work inside Asana.
Reporting requirements evolve. Review dashboards quarterly to ensure they still reflect business priorities.
Most organizations use only a fraction of Asana's reporting capabilities. SassyOS helps businesses unlock the full power of Asana reporting, analytics, workload management, and goal tracking.
Measuring team performance doesn't require expensive BI platforms, complicated spreadsheets, or dedicated analysts. If your organization already uses Asana, the tools are already available — you simply need the right reporting framework.
The most successful teams maintain complete visibility into workload, project health, delivery performance, and strategic goal progress. They identify risks early, balance capacity proactively, and make decisions based on data rather than assumptions.
Start with a single dashboard, track a handful of meaningful metrics, and build from there. The insights you uncover will transform how you manage projects, teams, and business outcomes.
SassyOS helps managers, team leads, and executives implement powerful Asana reporting systems tailored to their KPIs, workflows, and business goals.
Book a Free Asana Audit